Bayesian Belief Network
In our previous post on the Bayesian Belief Network, we learned about the basic concepts governing a BBN, belief propagation, and the construction of a discrete Bayesian Belief Network.
Armed with that knowledge, let us now explore in detail the following three key characteristics of the Bayesian Belief Network (BBN):
1. Event Prediction
2. Driver Analysis
3. Intervention Assessment
We’ve illustrated these characteristics with a real-world example. In health care services, the Member Experience Survey (MES) is sent to random customers who had issues about health care services and had contacted the customer care department. These customers are asked to rate the services they have availed currently or in the past. The output of the survey analysis is a score on a scale of 1-10. Based on the scores, customers are then divided into 3 categories as follows- score 0 – 6: Detractors, 7 – 8: Passive, 9 – 10: Promoters. Net Promoter Score (NPS) is a metric widely used by various businesses to understand customer satisfaction and the potential for business growth. It is calculated as “% Promoters – % of Detractors”. It is evident from the formula that if we want to increase NPS, we must control the % detractors. Thus, it becomes imperative to understand the various drivers of detractors.
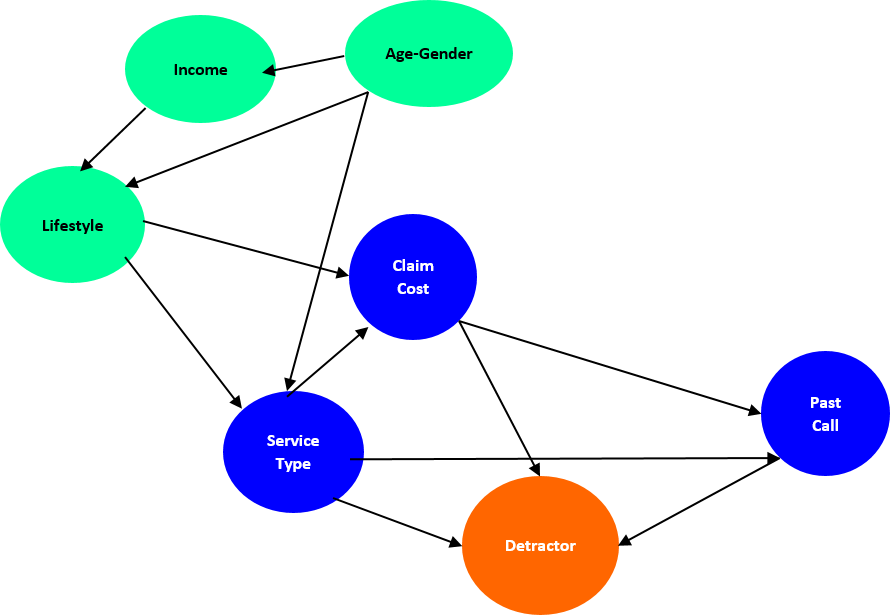
Under the assumption that the level of dissatisfaction/irritation is the reason for a customer to rank low in the MES survey, we will hypothesize a few prominent features along with a target to construct a discrete Bayesian Belief Network, and demonstrate the concept behind analyzing the drivers for that target and the effect of intervention at various levels. The features are:
- Service Type: Customers are not satisfied with a few of the services.
- Claim Cost: Denied claims with high claim costs may cause more dissatisfaction.
- Past Call: Many calls for the same issue may cause dissatisfaction/irritation.
- Lifestyle: Claim cost depends on the lifestyle of the customer.
- Income: Lifestyle depends on monthly income.
- Age-gender: Lifestyle also depends on the age and gender of a customer.
For now, let us assume the above features and their propositions are true and construct a Bayesian Belief Network structure.
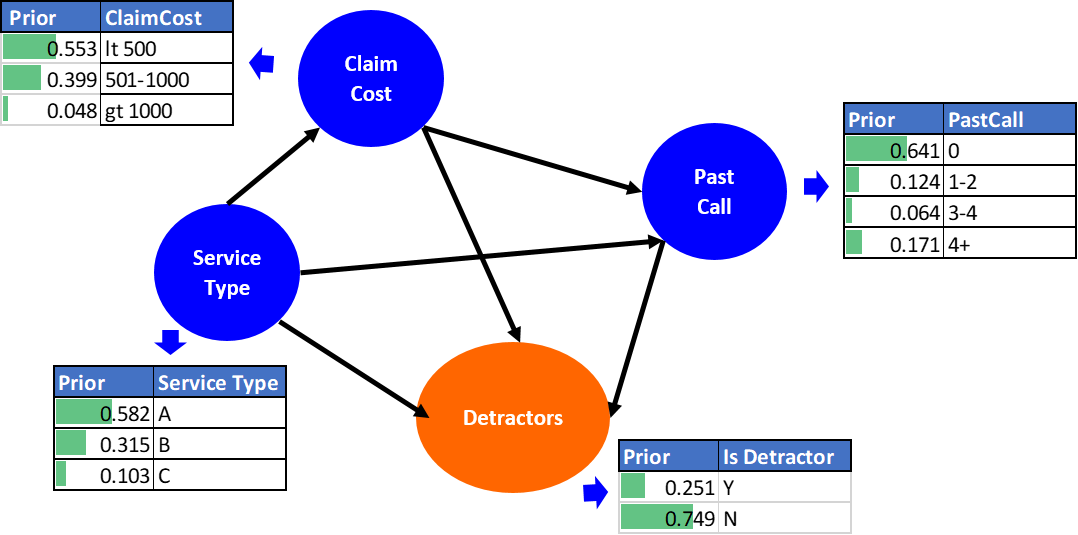
Let us reduce the number of nodes in the above use case and consider Service Type, Claim Cost, and Past Calls as the only predictors which explain the causality of the detractors in the model. A synthetic dataset is generated to illustrate this example. For each node, we have the belief and conditional probability tables as shown in the diagram below.
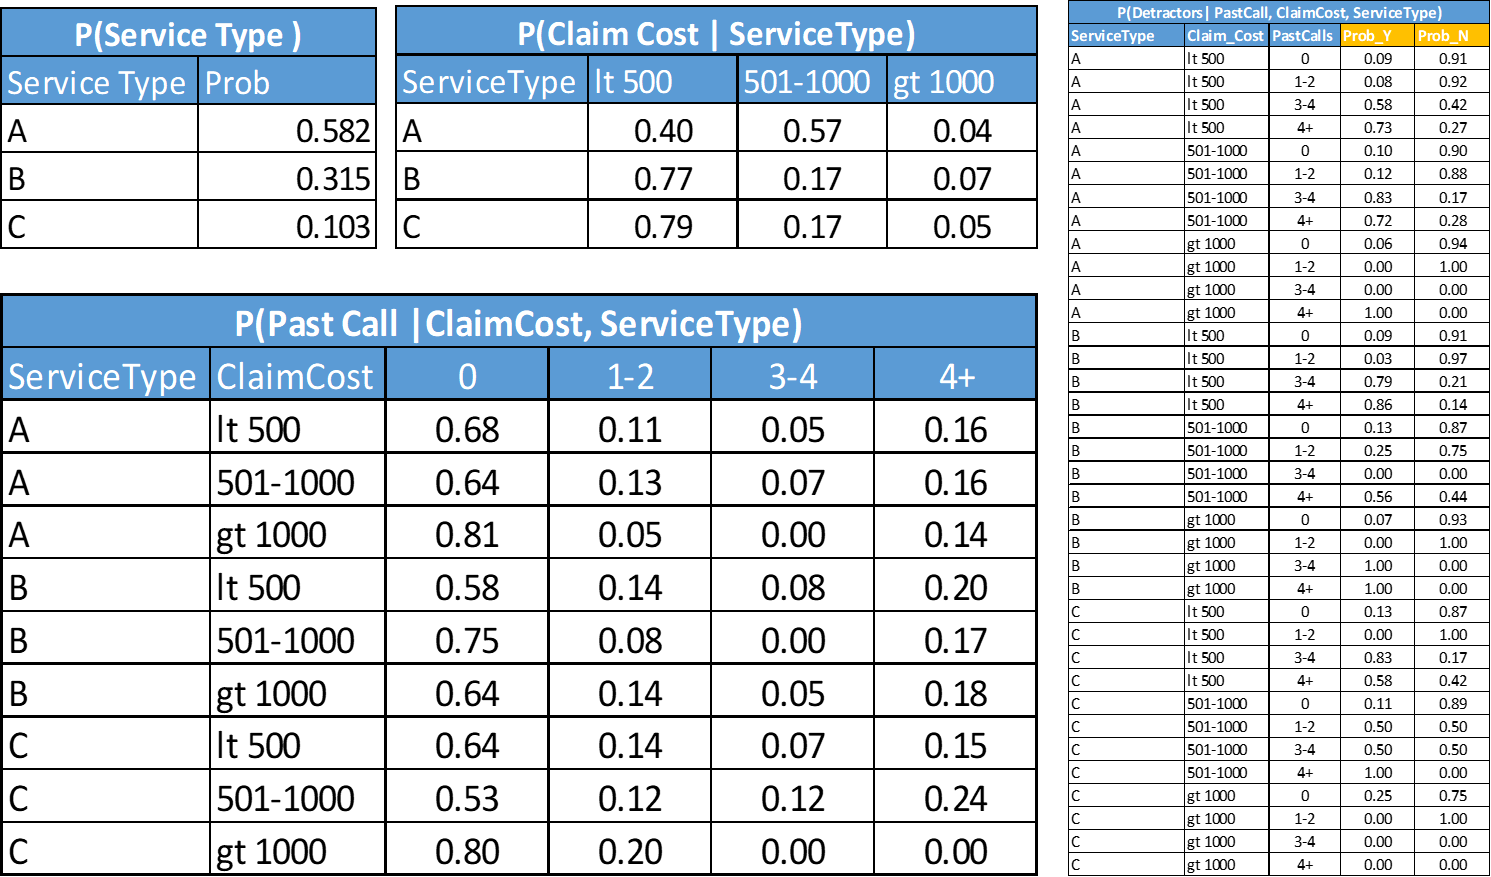
Parameter Learning
Conditional Probabilities table (CPT) for each node:
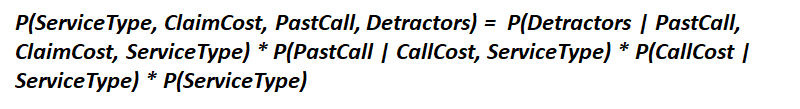
Now, given the CPTs for all the nodes, the joint distribution is estimated as below:
We now have the structure of the network, CPTs, prior beliefs for each node, and the joint distribution in place. This completes the Bayesian Belief Network. Let us go back to the three key characteristics of the Bayesian Belief Network, which we wanted to explore.
Event Prediction
How likely is it that a customer will become a detractor if he has called customer service once in the past within a defined time frame? The question sounds trivial as we have predicted such probabilities many times. With Bayesian Belief Network, given the data, we can estimate the probability of a customer being a detractor. We can use the concepts of marginal probability and Bayes theorem to estimate the probability as follows:

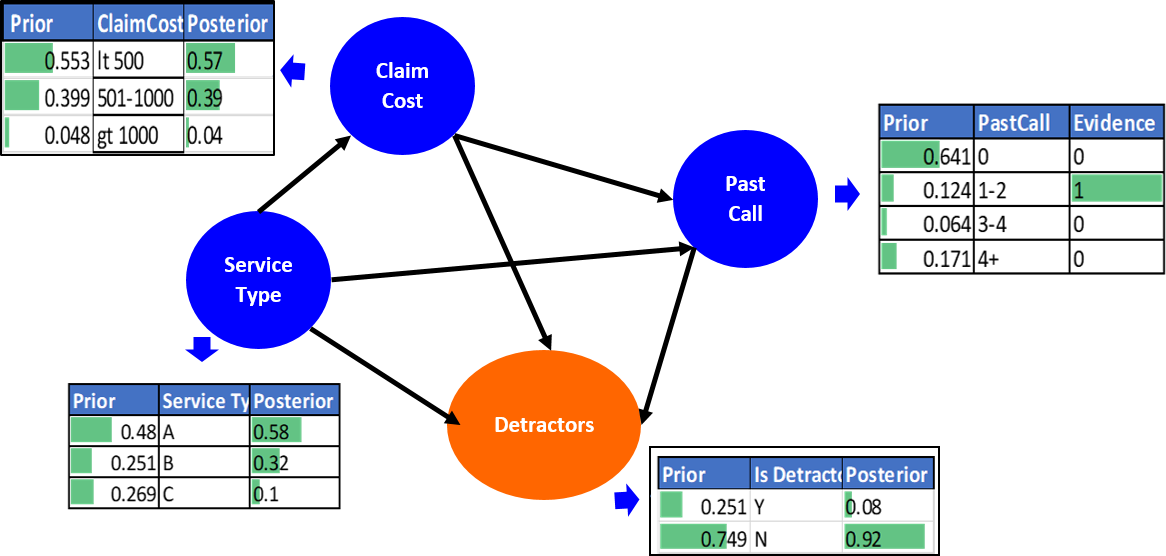
So, the evidence that a customer has called 1-2 times in the past, propagates through the network and we see the probability of him not being a detractor has updated itself from 0.749 to .92. This indicates that customers who called 1-2 times have a negative impact on whether a customer will become a detractor or not.
Similarly, we can see the propagation of multiple pieces of evidence through the network. For example, a customer requested service type A and has called 3-4 times. How likely is it for such a customer to become a detractor? The BBN will help you answer that.
Evidence/Driver Analysis
Interestingly, another question could be: what factors influence a customer to become a detractor?
The beauty of BBN is that it treats all nodes impartially, and it doesn’t differentiate between targets and predictors. Thus, the underlying probability propagation concepts remain the same for both of them. Using this feature, we can analyze the reasons/drivers behind specific evidence. If the evidence is that a customer is a detractor, we can analyze the drivers/causal factors. In this example, we have updated the detractor as 100%, and consequently, the evidence propagates through the network and updates all the beliefs. Let us look at the posteriors in the below figure:
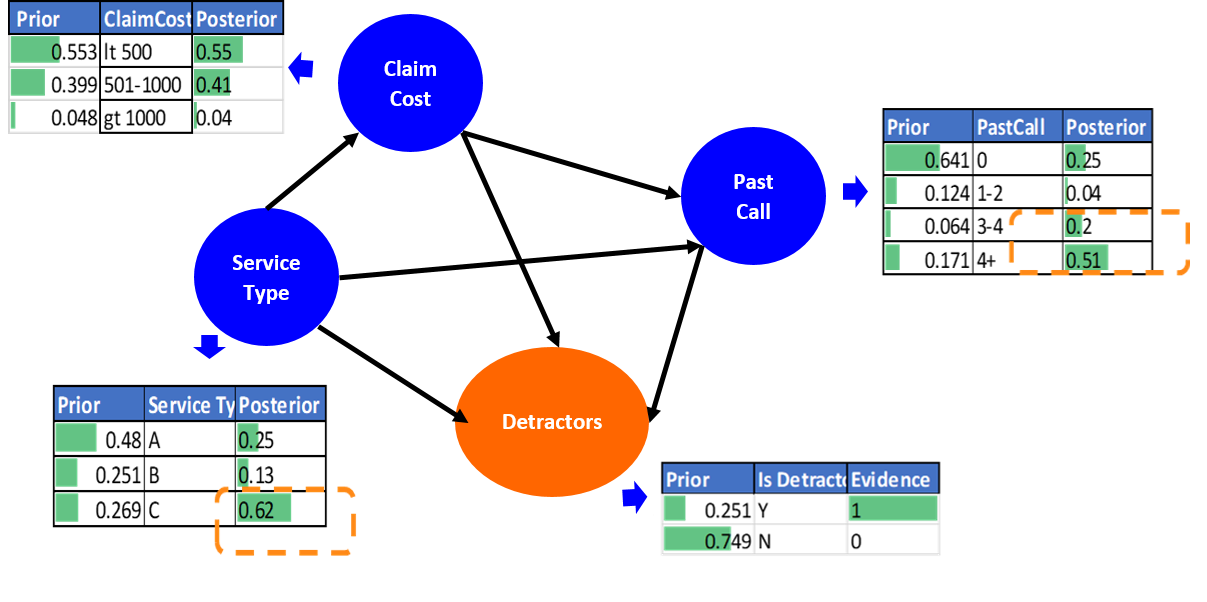
We can see the jump in the probability of service C from .27 to 0.62, and similarly, we can see the jump in the Past Call node for “3-4” and “4+”.
Interpretation 1
We can infer that customers who are opting for service C are having more issues as compared to other types of services, and consequently, they are calling a higher number of times.
Interpretation 2
Alternatively, we can also interpret that customers who are opting for service C are having complex issues, and customer care agents are not skilled enough to solve those issues.
Intervention Assessment
What if the management wants to work on the skills of the customer care advocates/agents, and they want to control the frequency of calls. Let us assess what will be the impact of their efforts if they’re going to bring “4+” past calls down to 0?
Honestly, it is a little tricky, in a way that we have to make small changes in our network. In this case, we need to remove all parental links from the actionable node, as it is controlled externally. Evidence to this node will no longer be observed. The modified network will look as follows in the diagram:
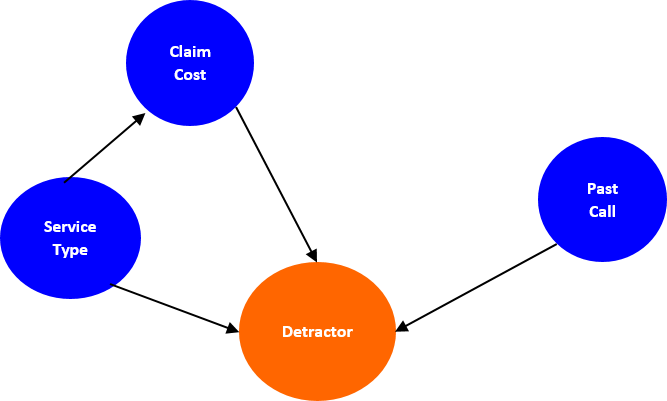
Besides, we also have to make some adjustments to the node attributes. Since we want to bring the “4+” calls to 0, it means the number of past calls will be <= 4. To handle this scenario, let us have two attributes “0-4” and “4+,” and we will change the evidence of the “0-4” level as 100%.
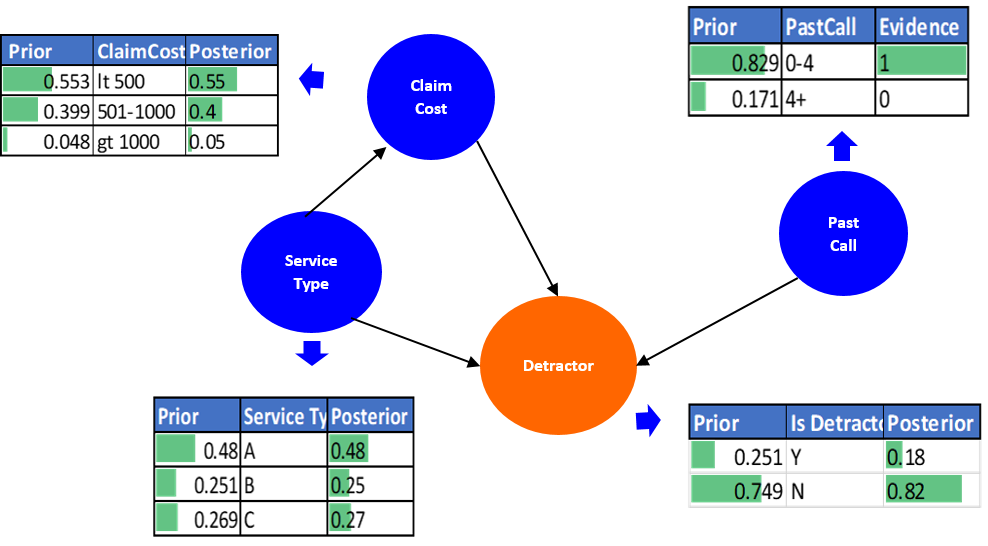
When we look at the posteriors now, we see that restricting the number of calls between 0-4 has the desired impact on the detractors. It updates the beliefs, and the probability of being a detractor has reduced from 25% to 18%, causing around 28% reduction in the detractor base.
Conclusion
We can apply BBN for many scenarios. However, it works best where we have collinearity or dependencies among the predictor variables, and the variables should be ordinal/categorical with a lesser number of levels.
Unlike other ML models, while quantifying the explainability of predictors, BBN also considers the interdependencies between them. If there are no interdependencies among predictors, then it is as good as other ML models from an application perspective. Still, Bayesian interpretability makes it more intuitive.
Too many variables make parameter learning and maintenance more difficult. Not all the buckets in CPT will have sufficient data to justify the events. However, due to its graphical nature and parent-child relationship, it relatively reduces the number of possible events, unlike other Bayesian methods.
Also, finding the optimum structure becomes complicated with too many variables.
In a competitive environment, the correct interpretation of drivers is crucial. Even slight biases may have a significant impact on the result. Bayesian Belief Network provides a useful but straightforward and intuitive method to respect the correlation between predictors and calculate the strength of drivers considering path modeling. Along with drivers, it also helps business executives to analyze the action plan. Its prediction power can be married with other machine learning algorithms to improve the model prediction.
References
1. https://www.bayesia.com/bayesian-networks-introduction
2. https://www.hindawi.com/journals/jat/2017/2525481/
3. https://www.edureka.co/blog/bayesian-networks/
4. https://www.saedsayad.com/docs/Bayesian_Belief_Network.pdf
5. https://cse.sc.edu/~mgv/csce582sp20/links/mradEtAl_APIN2015.pdf
6. https://github.com/sujeettiger/Bayesian-Belief-Network