NiFi is a simple tool, but it becomes complex when we fail to capture logs for complex pipelines. As you are aware, logging plays a vital role in debugging. By default, NiFi logs are stored in nifi-app.log for all applications running in NiFi instances, but if you want to track the logs only for your specific application, it is not straightforward with the default settings.
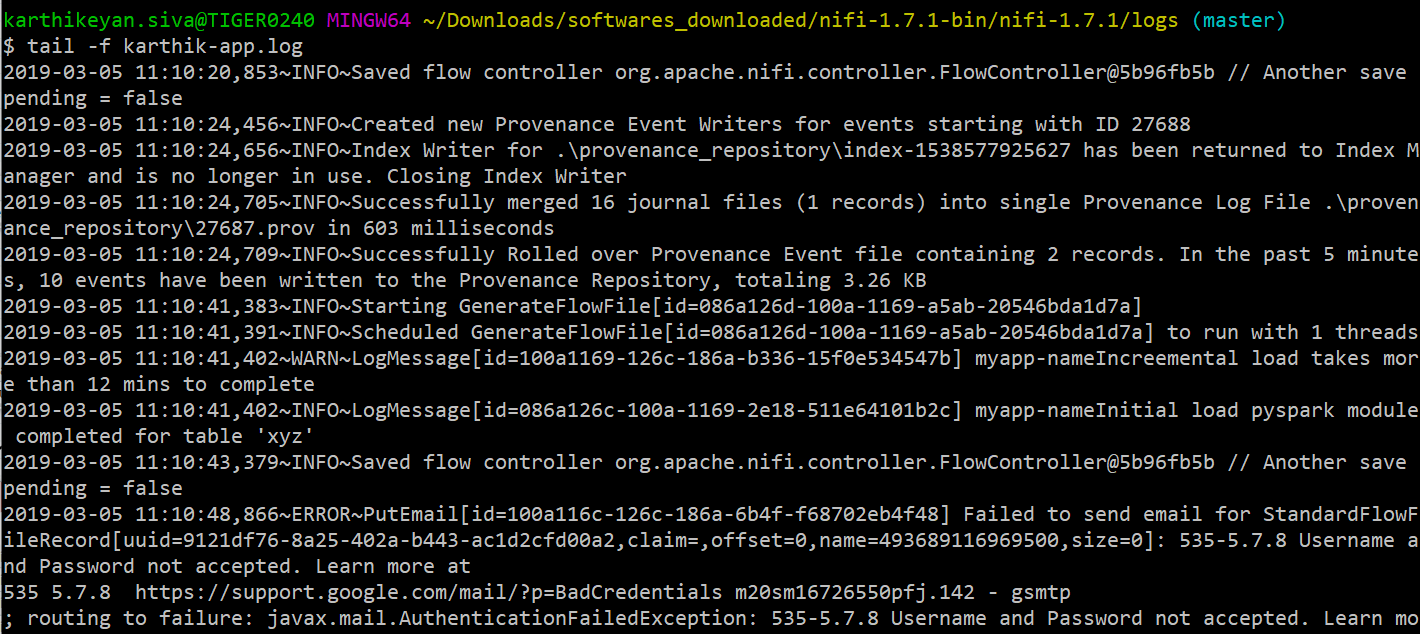
Cumbersome logs for all apps running in NiFi
By using the NiFi REST API and doing some configuration changes, we can build an automated pipeline for log capturing in Spark tables and trigger email alerts for errors and statuses (started, stopped and died) of NiFi machine(s).
How does it Work?
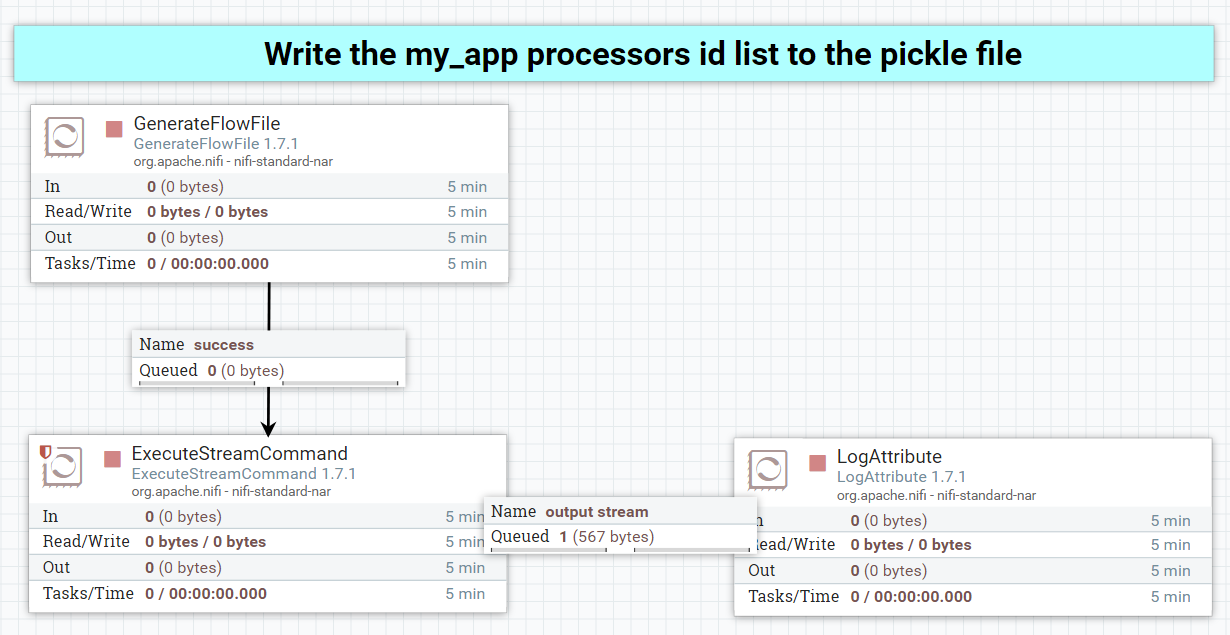
In a nutshell, the process involves passing the application root processor group ID as an input to the Python script write_my_processors.py and getting all the processor groups inside the root processor group using a REST API call. There may be multiple applications running in a NiFi instance, but it is enough to just input the processor group ID from where one needs to track it. Then iterate each processor group inside the root processor group of the specific application to get all the NiFi processor ids specific to it and write into a pickle file, which serializes the output list to a disk for later use by another Python application. Pickling the file has a distinct advantage when one keeps on overwriting the same data, but with mild modifications. Then we use the tailFileNiFi processor to track the customized log file (my-app.log)in real-time and use the Python script read_my_processors.py to filter the logs related to the application using the previously written pickle file.
Here’s the detailed step-by-step approach:
Step-1: It’s a good practice to not touch the nifi-app.log as this is used by many processes in NiFi. So, create a separate log file for your application by adding the following lines in your logback.xml
Note: This new log file is similar to nifi-app.log, except for the logging pattern.
Step-2: Get the application root processor group id either from the NiFi web UI or use REST API from the command line interface:
  http://localhost:8080/nifi/?processGroupId=0169100e-c297-1526-accf-f50a89c00283&componentIds=
  (or)
  curl -i -X GET http://localhost:8080/nifi-api/flow/search-results?q=my_app_root_processor_group_name
Trigger the Python script to get the updated processor ID list by passing the root processor group ID as an input. Run this script whenever processors are added/deleted from an application.
NiFi template(xml file) used in this blog is uploaded in the GitHub repository – https://github.com/
Step-3: Tail my-app.log and capture the logs related to my-app, then send email alerts for Warn, Error and Fatal. Also, all log level information gets written into HDFS. On top of that, Hive table will be created. Query this table using Spark for debugging.
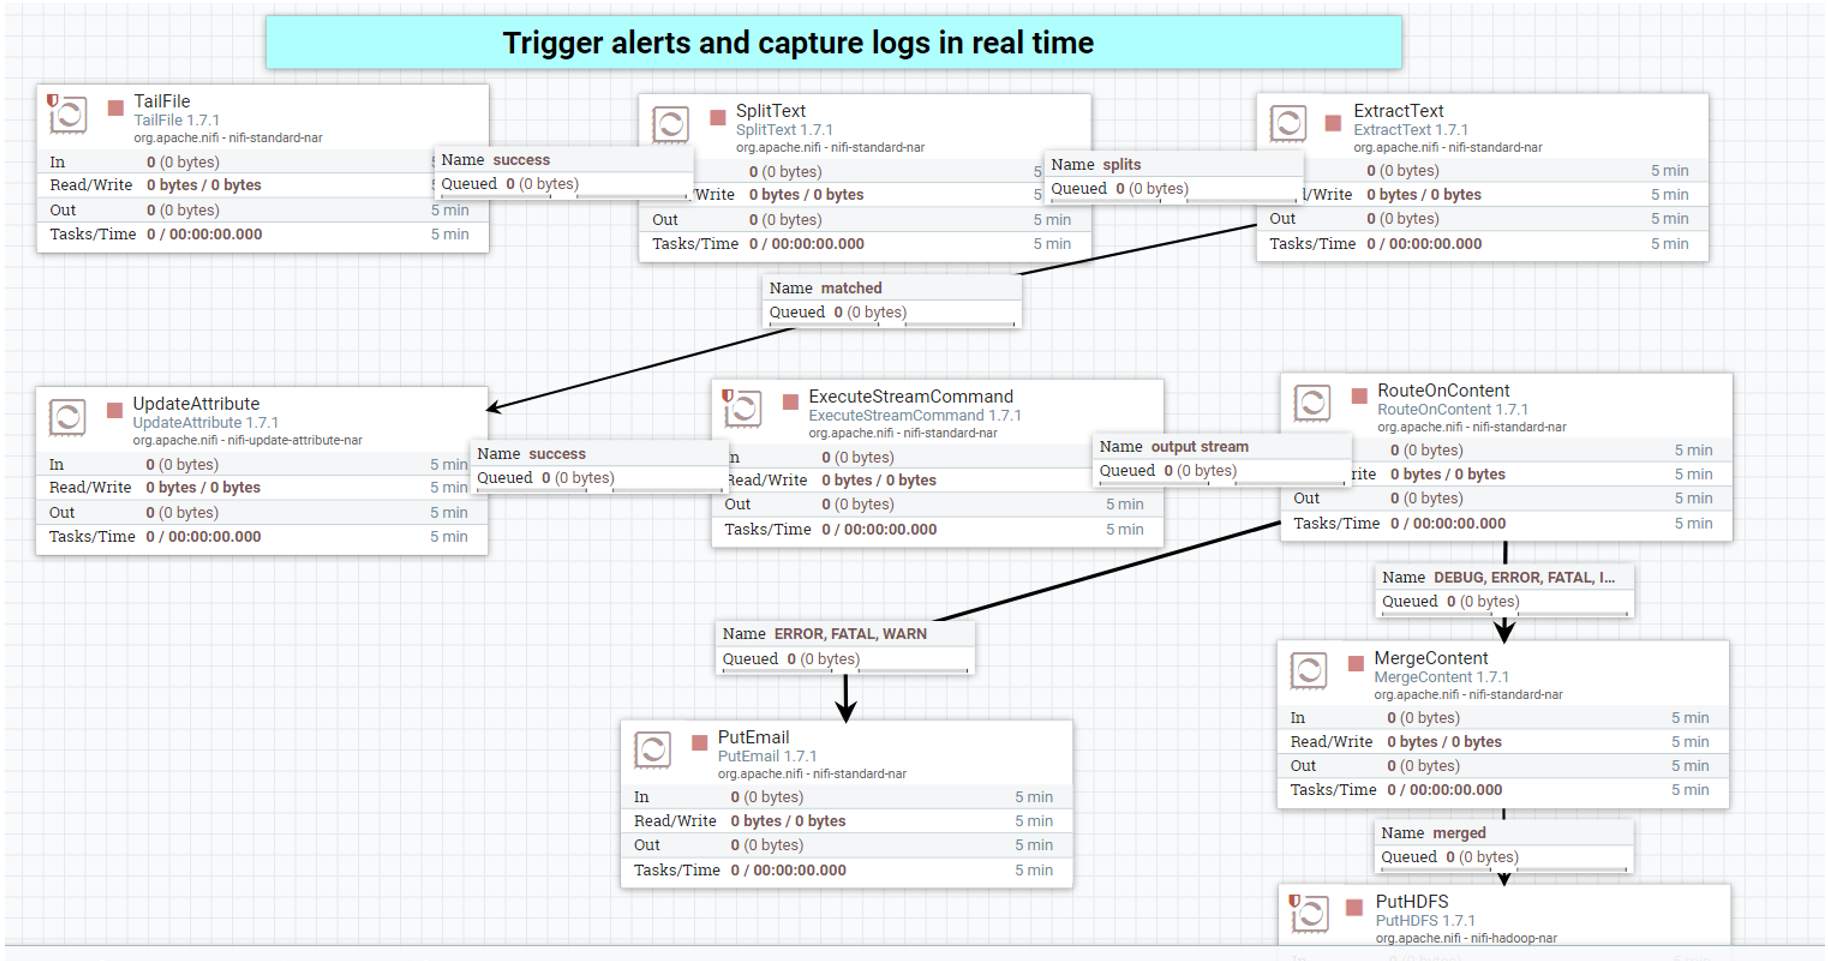
Simple pipeline to track complex pipeline
Note: Schedule the tailFile processor to run every 10 seconds, else it will keep on running by launching more number of tasks, which may occupy a lot of memory. Here is the Python script which needs to be called by ExecuteStreamCommand processor in NiFi.
Step-4: Create a Hive table on top of the HDFS directory where putHDFSprocessor is writing NiFi parsed logs.
create table nifi_log_tbl (log_level string,
                           processor_id string,
                           processor string,
                           message string,
                           date date,
                           time string)
ROW FORMAT DELIMITED FIELDS TERMINATED BY ','
STORED AS TEXTFILE
Location '/tmp/nifi_log_tbl/'
Note: If the Hive/Spark querying process is slow, it is due to a huge number of small files. So, periodically do compaction operation on Hive tables or use Spark coalesce function to have the file sizes & counts under control.
Step-5: Use Spark or Hive terminal to query those log tables for debugging.

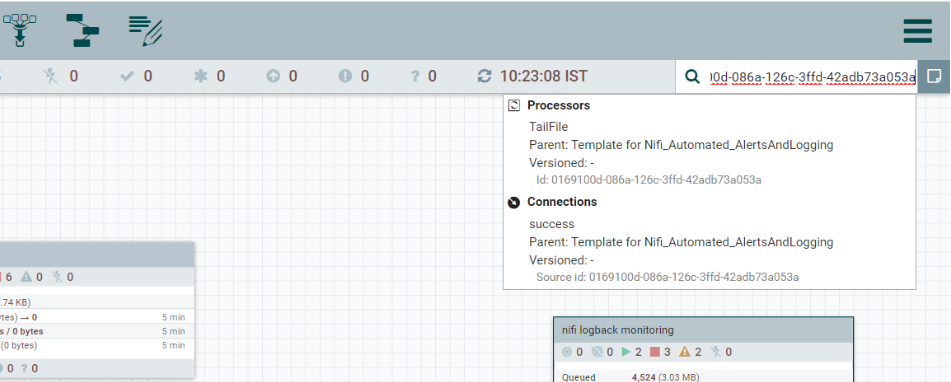
You can use the processor_id in the above logs to directly jump to the respective processor NiFi UI page by searching for it in the top right corner of the UI shown below. By doing this, debugging becomes flexible and logs are now under your control.
Note: Use LogMessage processor to create customized log messages for all log levels (debug, info, warn, error, fatal). This makes debugging better. These logs will be recorded in nifi-app.log and my-app.log, so that one can query the log table to track when a particular part of a NiFi complex pipeline is completed.
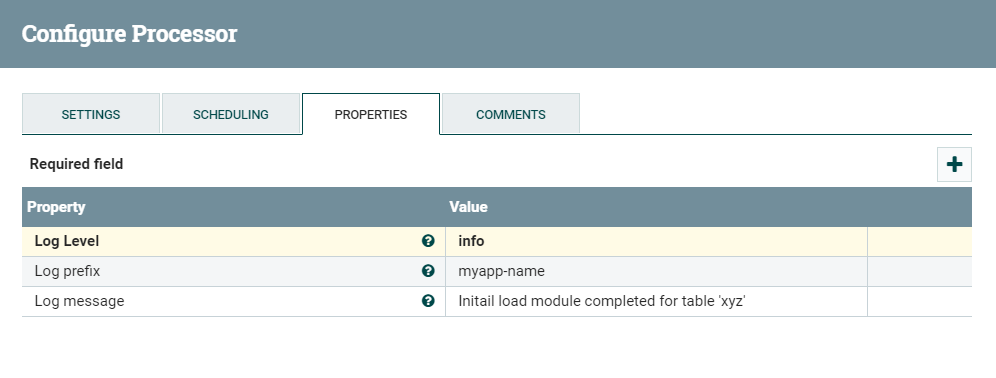
logMessage processor
Trigger Mail Alerts for the Status (Started, Stopped, and Died) of NiFi Machines
Step-1: To set up email notifications for NiFi machine status, update only two configuration files bootstrap.conf and boots
Uncomment the lines below in the bootstrap.conf file:
nifi.start.notification.services=email-notification
nifi.stop.notification.services=email-notification
nifi.dead.notification.services=email-notification
Step-2: Edit bootstrap-notification-
Here are the emails received when NiFi is started and stopped.
NiFi Start Event:
Subject : NiFi Started on Host localhost(162.234.117.244)
Hello,
Apache NiFi has been started on host localhost(162.234.117.244) at 2019/03/04 20:43:55.854 by user karthikeyan.siva
NiFi Stop Event:
Subject : NiFi Stopped on Host localhost(162.234.117.244)
Hello,
Apache NiFi has been told to initiate a shutdown on host localhost (162.234.117.244) at 2019/03/04 14:56:22.925 by user karthikeyan.siva
Wrapping Up
This will help one build a simple automated logging pipeline in NiFi to track complex data flow architectures. NiFi is a powerful tool for end-to-end data management. It can be used easily and quickly to build advanced applications with flexible architectures and advanced features.


