The situation now
COVID-19 has brought the world to a standstill. Countries around the world are grappling to tide over this medical emergency that has put the lives of their entire populations at risk. Governments across the world are taking measured actions to control the spread of the disease, trying to strike a balance between risks of an epidemic outbreak, health infrastructure, economic impacts, and other considerations. Along the way, they need to make several decisions. Should one go after contact tracing and quarantining suspected cases or announce a complete lockdown? What is a suitable time for a stringent action, such as a lockdown, with economic implications? How does one plan for critical resources like ventilators and hospital beds? Epidemic modeling enables simulating potential scenarios that can help governments to estimate the impact of various strategies.
Epidemic Modeling
Epidemic modeling is used to calculate the number of people a disease would affect and the time it takes for it to reach a peak. Kermack & McKendrick proposed epidemic modeling for disease spread (https://link.springer.com/article/10.1007%2FBF02464423) where the population is divided into three groups, Susceptible to infection (S), Infected (I), and Recovered from infection (R). Called the S-I-R model, it helps in estimating how the number of infected people varies over time. An extension to this is the S-E-I-R model, where there is a latency period for the disease to exhibit symptoms, after an individual is exposed (E) to it.
SEIR Model
Basic definitions:
- N: total population
- S: number of susceptible individuals (who have not had the infection)
- E: number of individuals exposed to infected people, but not developed infection yet
- I: number of infected individuals
- R: number of recovered/dead individuals
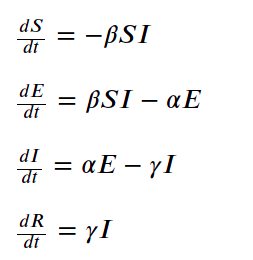
The equations for the SEIR model are given by

where
- ?? is the average contact rate in population, between the susceptible and infected individuals
- ?? is the inverse of incubation period 1/????????
- ?? is the inverse of mean infectious period 1/????????
These parameters aid in the estimation of the basic reproduction number (R0) of a disease. R0 is the expected number of cases generated directly by one case in the population, where all individuals are susceptible to infection. Higher R0 numbers indicate a rapid spread of the epidemic, while R0 less than 1 means that the epidemic dies out.
R0 = ?? / ??
Estimating spread
Being able to get good estimates of these parameters will help governments in planning their course of action. Let us estimate the basic reproduction number for COVID-19.
- The median incubation period is around 5 days (https://annals.org/aim/fullarticle/2762808/incubation-period-coronavirus-disease-2019-covid-19-from-publicly-reported), and hence ?? = 1 / 5 = 0.2
- Mean infectious period is 2.3 days (WHO Report) and ?? = 1/ 2.3 = 0.434
- The suspected to infected ratio, E/I is taken to be 2.3 (from WHO Report)
- The last parameter ?? is to be estimated from the daily number of cases reported.
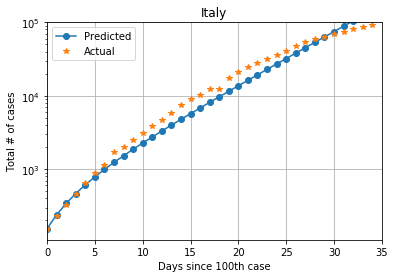
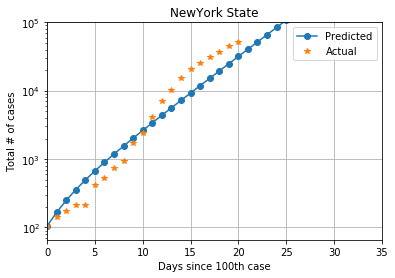
Starting from the day with at least 100 cases and using the parameters, we estimate the contact ratio (>??) for various countries. This value is iteratively found by minimizing the RMS error between measured cases and predicted value.
For Italy, with a population of 60.55 million, from 155 cases on February 23, 2020, to 92472 cases on March 27, 2020, the estimate of average contact rate is ?? = 1.1, giving a R0 >value of 2.53

The state of New York in the US has emerged as another hot-spot for the spread of COVID-19. It has a population of 19.45 million. From 105 cases on March 8, 2020, to 52318 cases on March 28, 2020, average contact rate of New York is ??= 1.5 and the R0 value is 3.45

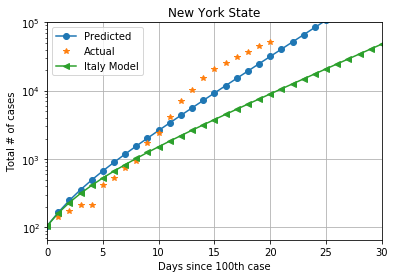
The two R0 values do not appear to be much different, but planning for one situation based on estimates from another place can be catastrophic. The plot below shows cases in New York, with the estimates using Italy also shown. We can observe the wide divergence in cases predicted after 10 days.

Understanding the epidemic
Why are the estimates so different for the same epidemic? This is due to the uncertainties associated with data. Uncertainties in data arise as:
- Case reporting procedures vary by country – from hospital to the national health centers like CDC
- Testing strategy differs – if the country is testing everyone like South Korea or only symptomatic individuals
- Preventive actions taken differ – like compulsory quarantining vs. status quo
- Case ascertainment may not be effective when the healthcare system is overwhelmed while dealing with the pandemic
- Any preventive steps taken by the country to contain the disease like restricting international flights, compulsory quarantining of returnees, etc. may not be captured.
With different ways of collecting data and reporting, it is challenging to arrive at a very good estimate of the basic reproduction number. In fact, studies by researchers from Dec 2019 to Feb 2020 on COVID-19 report a wide range for basic reproduction numbers, from 1.9 to 6.49. (https://academic.oup.com/jtm/article/27/2/taaa021/5735319)
Another challenge is to estimate the symptomatic Case Fatality Risk (sCFR) – the proportion of fatalities in a population of symptomatic individuals. sCFR will enable doctors to assess the degree of severity and make treatment decisions. Based on sCFR, hospital managers and governments can do advanced capacity planning for intensive care facilities like ventilators and medication. However, when the health systems are overwhelmed, cases with milder symptoms tend to be discarded. This leads to a significant under-representation of cases and a corresponding overestimation of sCFR. Similarly, lack of patient demographics poses a challenge in understanding relative sCFR across age-groups. A study to assess relative sCFR of COVID-19 and necessary precautions taken during such an estimation can be found here –https://www.nature.com/articles/s41591-020-0822-7.
Lastly, one should be cautious of the potential biases when making estimates in these scenarios. Number of confirmed cases pertain to individuals who are tested or have shown symptoms. The number of infected, but asymptomatic and undiagnosed individuals is usually not known. Disease severity in reported cases will differ from that of all cases in the population, as observed in the case of the Ebola outbreak. Also, delays in reporting cases and fatalities, a common occurrence during stressed times, leads to the underestimation of sCFR as well as transmission dynamics. Epidemic growth rate itself plays a key role in this bias. When doctors have to prioritize cases for advanced care based on chances of survival, a downward bias of CFR occurs. In extreme cases, poor diagnosis (false positives) can lead to hospitalization, which then results in the (uninfected) individual recovering, leading to a spurious beneficial effect of hospitalization. Further details on various strategies to correct for these biases in epidemic modeling are published here –https://journals.plos.org/plosntds/article?id=10.1371/journal.pntd.0003846.


