Around 2001-2003, at the hallowed portals of the Department of Management Studies(DoMS), Indian Institute of Science, Prof.N.J.Rao – Chairman of the Department at that time, introduced to us – the students of the Quant-MBA program now known as Master’s in Business Analytics, to the exciting world of System Dynamics.
System Dynamics as a discipline was originally founded by Prof. Jay Forrester (1918-2016), at the MIT. MIT’s Open courseware curriculum on System Dynamics can be found here. Prof. Rao at DoMS IISc. had structured the course he offered us on very similar lines. The course provided us theoretical foundations, tools, and techniques to model, analyze and understand the behavior of systems – both baseline behavior, as well as the response of a system to interventions.
Put simply, you can think of a “system” as an organization of some basic elements/building blocks. System Dynamics provides such building blocks. Stock (Level) variables, Flow (Rate) variables, and a range of other variables (auxiliary, shadow, etc.)

Think of a simple pumping system depicted above, which lifts water from an underground tank to an overhead tank via an electric pump. The level (or cubic volume) of water in both the tanks could be thought of as a level variable, the rate of pumping of the pump (in volume/minute) literally the rate variable and strength of current is the auxiliary variable (which impacts the rate of pumping). This is an example of a very simple system. The initial conditions for the stock levels, the rate of pumping, and a somewhat randomly varying strength of current could be specified. If you simulate the system to run forward in time for a few epochs (which could be minutes/hours), it is easy to guess what will happen!
Another model, a simplified version of a population growth model, can be found below. A very low initial population grows exponentially large over time as the birth rate is higher than the death rate, and a growing population further adds to the births.

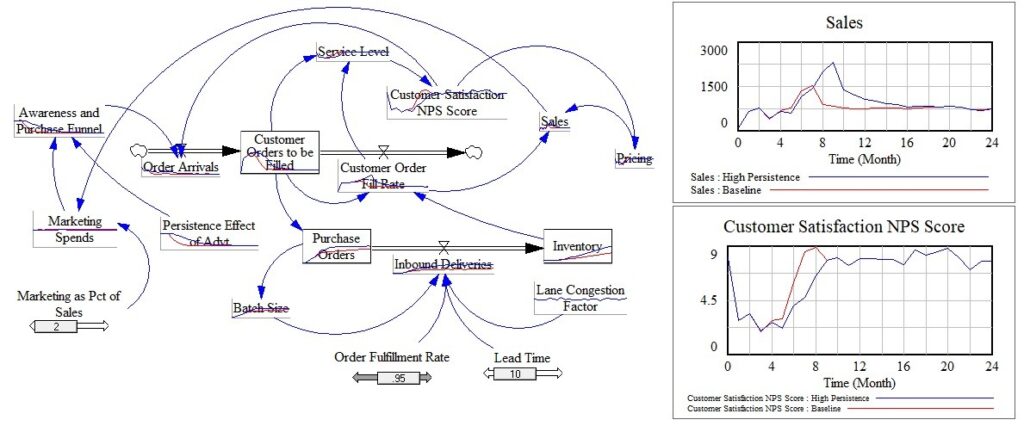
Many business systems, such as supply chain, inventory management, delayed impact of marketing, etc., could be modeled effectively through this approach. Here’s a very simple example that the business world can closely relate to. A business system with an interplay of marketing, sales, supply chain, and customer service aspects. See how the sales response changes over time to the various factors that influence (the high sales scenario is due to higher persistence of the advertisement, leading to sharper sales peak for the same level of marketing investments).

Even more complex systems could be modeled, using multiple such variables and by specifying the connections between those different variables – typically in the form of arrows, and the underlying equations. The mathematically specified relations range from simple addition/multiplication/divisions, exponential growth/smoothing/decay effects, time delays of different orders, etc. For example, think of how advertisement effects decay over time, or how an economic stimulus takes time to take effect, or as we will see a bit later, how “Social Distancing” could slow down the spread of COVID-19. Once these building blocks are wired up, the overall behavior of the system could be simulated over multiple time periods into the future – to understand baseline behavior, and to check the response of systems to any interventions that impact one or more parameters.
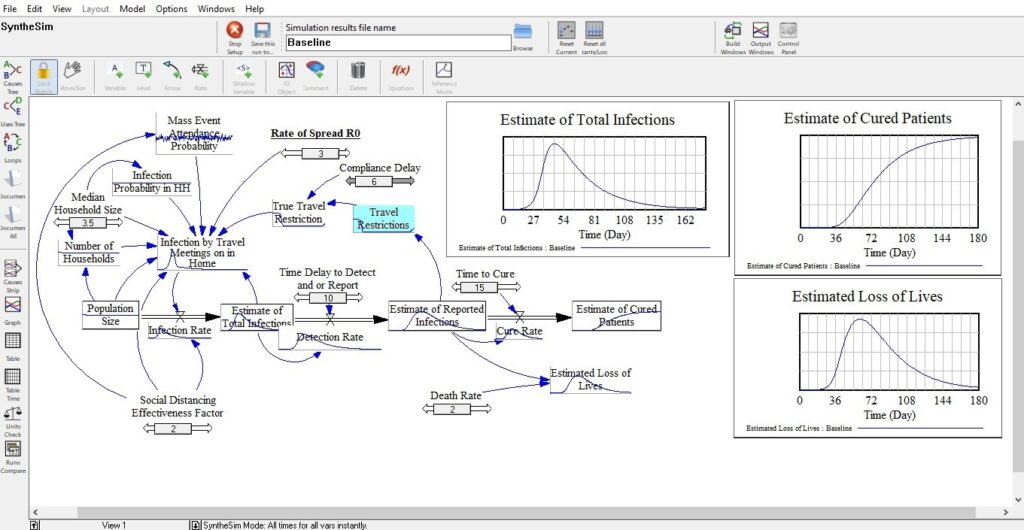
You could now take a minute to absorb the representative model of COVID-19 spread, built using the concepts and tools to learn and practice System Dynamics. The tool I used for building this system is Vensim from Ventana Systems. They offer a Personal Learning Edition (which is what I used for this exercise), as well as commercial licensing options.

Of course, the model has NOT been built with thorough medical/epidemiological expertise, so I will strictly stay away from making any inferences on this, talking numbers, countries, etc. However, this is still a useful illustration of how system dynamics could be used to understand a phenomenon like the rapid spread of Coronavirus (resulting in a disease known as COVID-19) that affects a social system like an entire population.
While the core driver is the rate of spread (known as R0), some of the day-to-day social activities of the general population like traveling, meeting, and attendance of large gatherings, all have an impact on the spread and have been modeled, as can be seen visually. Interventions in terms of travel restrictions, social distancing (more as a suppression factor) have been built in as well. There are mathematical equations specifying these relationships/connections as well (for e.g. compliance delay means the announced travel restrictions take time to take effect and hence spread continues unchecked a bit).
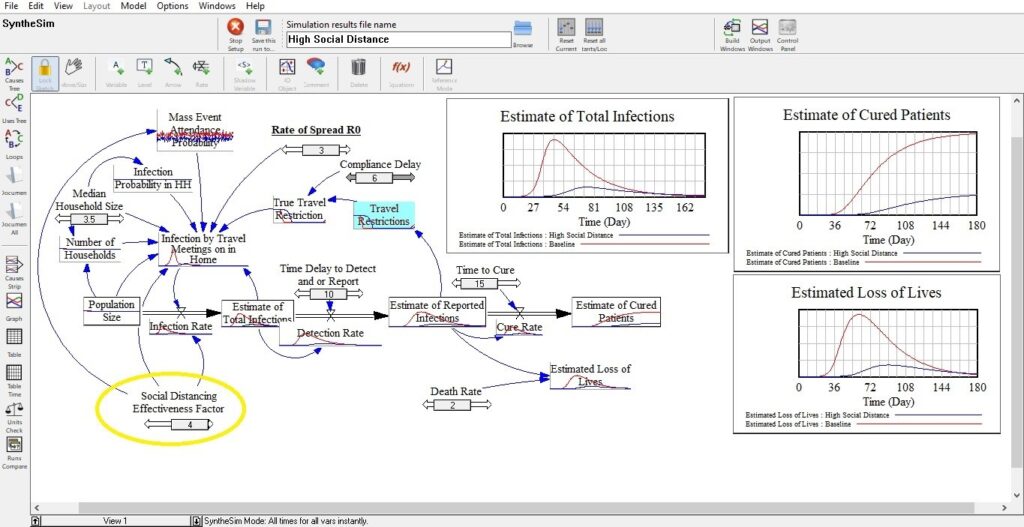
The now-familiar “flatten the curve” effect, and how that is driven by a change in the effectiveness of social distancing is the key feature I personally wanted to observe from the different simulation scenarios more than the numbers themselves. The flatter and a bit shifted out curve could be seen by comparing the below diagram with the baseline scenario, which is of moderate social distancing. The scenario with stricter adherence (doubling in social distancing effectiveness factor) shows the classic flattening effect as well as the shifting out of the peak. Both of these are called out by public policymakers, epidemiologists, and the medical fraternity as key factors in coming out of the current health crises without severe shock to healthcare systems around the world.

So, while you stay safe by social distancing and remote working, take some time to read up and know this subject a bit better. When you get back to work, think about the business systems/situations you would apply such an approach to, and what value can such forward-looking insights provide.
And hey, if you get bored, there’s a Beer Game simulation (a classic supply chain and inventory distribution problem) that could be played using the very same concepts too. Check this link. Give it a try. Cheers!


