Introduction:
Lots of small to midsize companies use Analytics to understand business activity, lower their costs and increase their reach. Some of these companies may intend to build and maintain an Analytics pipeline but change their mind when they see how much money and tech know-how it takes. For any enterprise, data is an asset. And they are unwilling to share this asset with external players: they might end up risking their market advantage. To extract maximum value from intelligence harvesting, enterprises need to build and maintain their own data warehouses and surrounding infrastructure.
The Analytics field is buzzing with talks on applications related to Machine Learning, which have complex requirements like storing and processing unstructured streaming data. Instead of pushing themselves towards advanced analytics, companies can extract a lot of value simply by using good reporting infrastructure. This is because currently a lot of SME activity is still at the batch data level. From an infrastructure POV, cloud players like Amazon Web Services (AWS) and Microsoft Azure have taken away a lot of complexity. This has enabled companies to implement an accurate, robust reporting infrastructure (more or less) independently and economically. This article is about a specific lightweight implementation of Data Engineering using AWS, which would be perfect for an SME. By the time you finish reading this, you will:
1) Understand the basics of a simple Data Engineering pipeline
2) Know the details of a specific kind of AWS-based Analytics pipeline
3) Apply this design thinking to a similar problem you may come across
Analytics Data Pipeline:
SMEs have their business activity data stored in different places. Getting it all together so that a broad picture of the business’s health emerges is one of the big challenges in analytics. Gathering data from sources, storing it in a structured and accurate manner, then using that data to create reports and visualizations can give SMEs relatively large gains. From a process standpoint, this is what it might look like:

Figure 1: Simple Data Pipeline
But from a business activity effort standpoint, it’s more like:

Figure 2: Business Activity involved in a Data Pipeline
Here’s what’s interesting: although the first two components of the process consume most time and effort, when you look at it from a value chain standpoint, value is realized in the Analyze component.
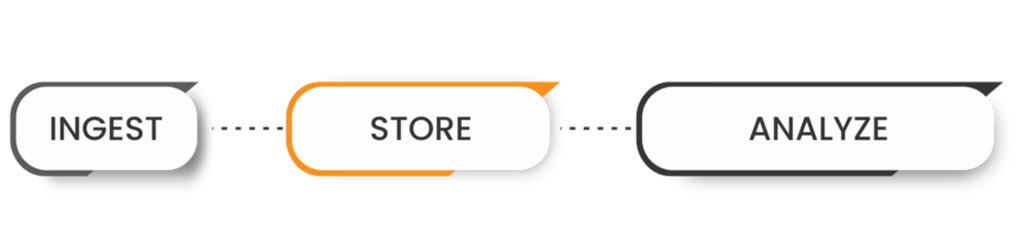
Figure 3: Analytics Value Chain
The curiously inverse relationship between effort and value keeps SMEs wondering if they will realize the returns they expect on their investment and minimize costs. Analytics today might seem to be all about Machine Learning and cutting-edge technology, but SMEs can realize a lot of value by using relatively simple analytics like:
1) Time series graph on business activity for leadership
2) Bar graph visualization for sales growth over the years
3) For the Sales team: a refreshed, filterable dashboard showing the top ten clients over a chosen time period
4) For the Operations team: an email blast every morning at eight depicting business activity expense over a chosen time period
Many strategic challenges that SMEs face, like business reorganization, controlling operating costs, crisis management, require accurate data to solve. Having an Analytics data pipeline in the cloud allows enterprises to take cost-optimized, data-driven decisions. These can include both strategic decision-making for C-Suite and business-as-usual metrics for the Operations and Sales teams, allowing executives to track their progress. In a nutshell, an Analytics data pipeline makes company information accessible to executives. This is valuable in itself because it enables metrics monitoring (including the derived benefits like forecasting predictions). There you have it, folks: a convincing case for SMEs to experiment with building an in-house Analytics pipeline.
Mechanics of the pipeline:
Before we get into vendors and the value they bring, here’s something for you to think about: there are as many ways to build an Analytics pipeline as there are stars in the sky. The challenge here is to create a data pipeline that is hosted on a secure cloud infrastructure. It’s important to use cloud-native compute and storage components so that the infrastructure is easy to build and operate for an SME.
Usually, source data for SMEs are in the following formats:
1) Payment information stored in Excel
2) Business activity information coming in as API
3) Third-party interaction exported as a .CSV to a location like S3
Using AWS as a platform enables SMEs to leverage the serverless compute feature of AWS Lambda when ingesting the source data into an Aurora Postgres RDBMS. Lambda allows many programming interfaces including Python, a widely used language. Back in 2016-17, the total runtime for Lambda was at five minutes, which was not nearly enough for ETL. Two years later, the limit was increased to 15 minutes. This is still too little time to execute most ETL jobs, but enough for the batch data ingestion requirements of SMEs.
Lambda is usually hosted within a private subnet in the enterprise Virtual Private Cloud (VPC), but it can communicate with third-party source systems through a Network Address Translator (NAT) and Internet Gateways (IG). Python’s libraries (like Pandas) make tabular data quick and easy to process. Once processed, the output dataframe from Lambda is stored onto a table in the Aurora Postgres Database. Aurora prefix is for the AWS flavor of the Postgres Database offering. It makes sense to choose a vanilla relational database because most data is in Excel-type rows and columns format anyway, and reporting engines like Tableau and other BI tools work well with RDBMS engines.
Mapping the components to the process outlined in Figure 1, we get:
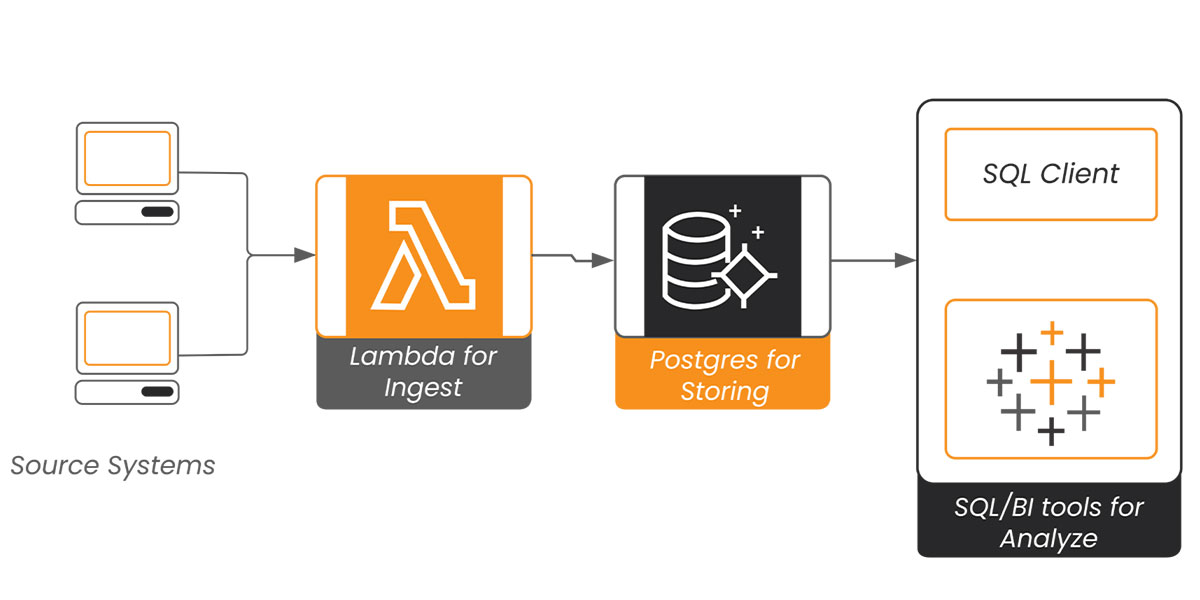
Figure 4: Revisiting Analytics pipeline
AWS Architecture:
Let’s take a deeper look into AWS architecture.
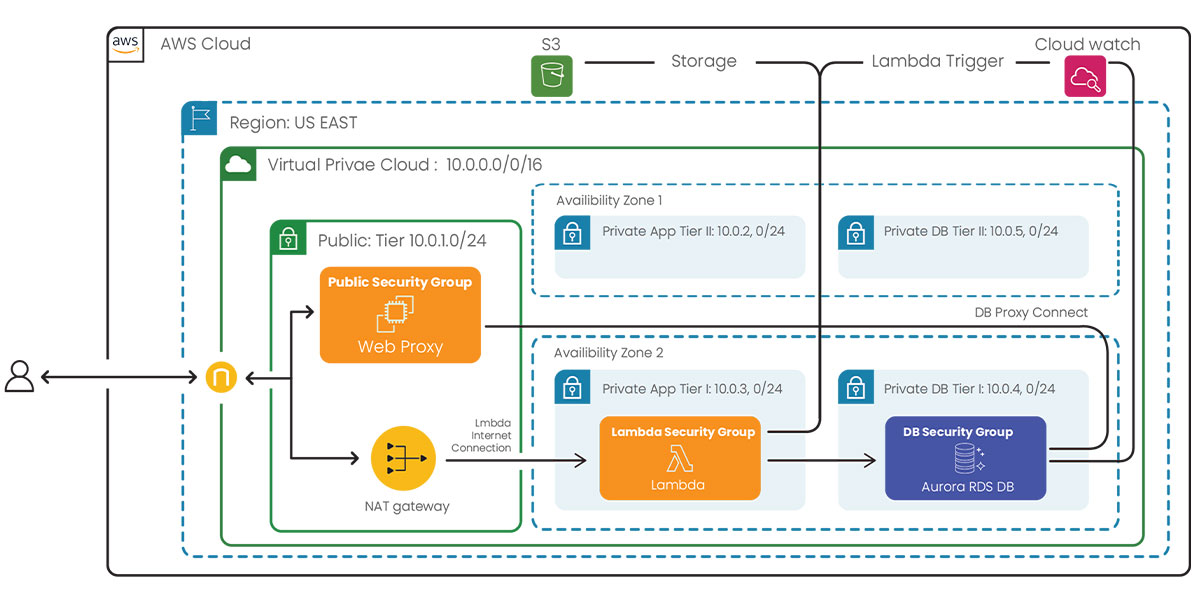
Figure 5: AWS-based batch data processing architecture using Serverless Lambda function and RDS database
Figure 5 adds more details to the AWS aspects of a Data Engineering pipeline. Operating on AWS requires companies to share security responsibilities such as:
1) Hosting AWS components with a VPC
2) Identifying public and private subnets
3) Ensuring IG and NAT Gateways can allow components hosted within private subnets to communicate with the internet
4) Provisioning the Database as publicly not accessible
5) Setting aside a dedicated EC2 to route web traffic to this publicly inaccessible database
6) Provisioning security groups for EC2’s public subnet (Lambda in private subnet and Database in DB subnet)
7) Provisioning subnets for app and DB tier in two different Availability Zones (AZ) to ensure (a) DB tier provisioning requirements are met, and (b) Lambda doesn’t run out of IPs when triggered
Running the pipeline:
New data is ingested by timed invocation of Lambda using CloudWatch rules. CloudWatch monitors AWS resources and invokes services at set times using Chron expression. CloudWatch can also be effectively used as a SQL Server Job agent to trigger Lambda events. This accommodates activities with different frequencies like:
1) Refreshing sales activity (daily)
2) Operating Costs information (weekly)
3) Payment activity (biweekly)
4) Tax information (monthly)
CloudWatch can deploy a specific Python script (that takes data from the source, does necessary transformations, and loads it onto a table with known structure) to Lambda once the respective source file or data refresh frequency is known.
Moving on to Postgres, its unique Materialized View and SQL Stored procedure feature (that allows further processing) can also be invoked using a combination of Lambda and CloudWatch. This workflow is helpful to propagate base data after refresh into denormalized, wide tables which can store company-wide sales and operations information.
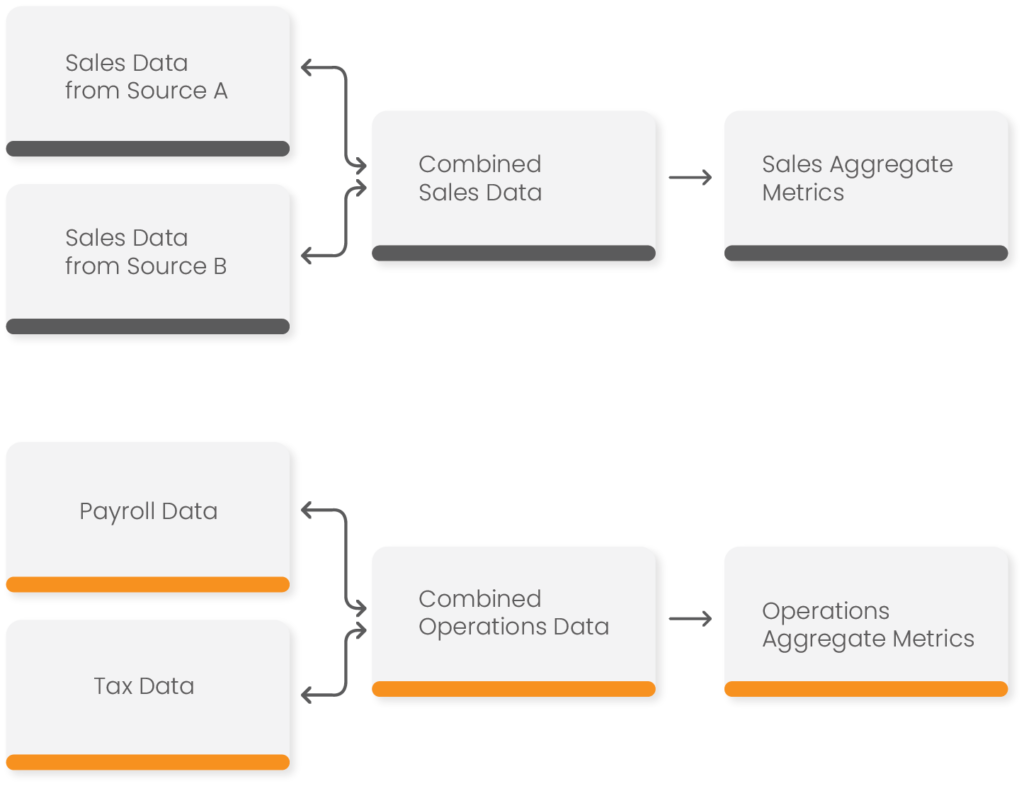
Figure 6: An example of data flow for building aggregate metrics
Once respective views are refreshed with the latest data, we can connect to the Database using a BI tool for reporting and analysis. It’s important to remember that because we are operating on the AWS ecosystem, the Database must be provisioned as publicly inaccessible and be hosted within a private subnet. Users should only be able to reach it through a web proxy, like nginx or httpd, that is set up on an EC2 on the public subnet to route traffic within the VPC.
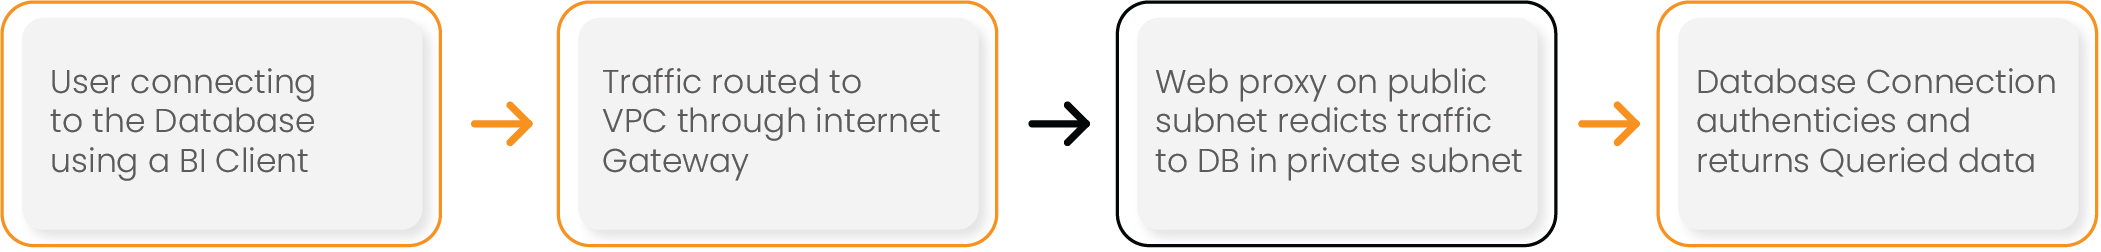
Figure 7: BI Connection flow to DB
Access to data can be controlled at the Database level (by granting or denying access to a specific schema) and at the connection level (by whitelisting specific IPs to allow connections and denying connect access by default).
Accuracy is the name of the game:
So you have a really secure and robust AWS architecture, a well-tested Python code for Lambda executions, and a not-so-cheap BI tool subscription. Are you all set? Not really. You might just miss the bus if inaccuracy creeps into the tables during data refresh. A dashboard is only as good as the accuracy of the numbers it displays. Take extra care to ensure that the schema tables you have designed include metadata columns required to identify inaccurate and duplicate data.
Conclusion:
In this article, we took a narrow-angle approach to a specific Data Engineering example. We saw the Effort vs Return spectrum in the Analytics value chain and the value that can be harvested by taking advantage of the available Cloud options. We noted the value in empowering C-suite leaders and company executives with descriptive interactive dashboards.
We looked at building a specific AWS cloud-based Data Engineering pipeline that is relatively uncomplicated and can be implemented by SMEs. We went over the architecture and its different components and briefly touched on the elements of running a pipeline and finally, on the importance of accuracy in reporting and analysis.
Although we saw one specific implementation in this article, the attempt here is to convey the idea that getting value out of an in-house Analytics pipeline is easier than what it used to be say a decade ago. With open source and cloud tools here to make the journey easy, it doesn’t take long to explore and exploit the value hidden in data.
[References:
Disruptive Analytics, Apress, 2016]